The Secret to More Profitable Decision Making in Vacation Rental Management
New occupancy dashboard enables vacation rental management professionals to make better business decisions
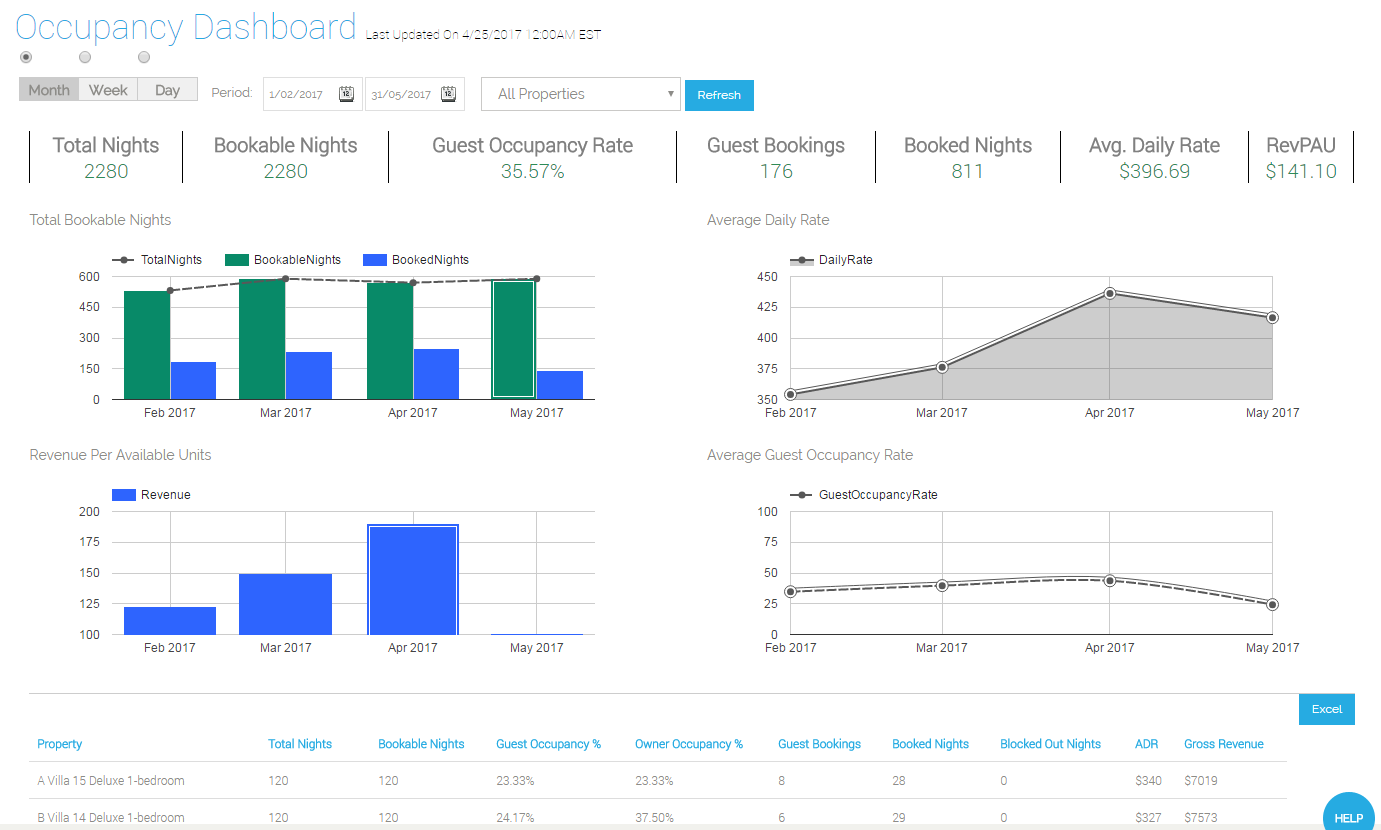
Fire up Kigo’s new Occupancy Dashboard and you’ll know instantly where you stand regarding occupancy and rates, empowering you to make smart decisions that will improve your bottom line.

Clearly displayed in charts and graphs are key metrics such as occupancy, Average Daily Rate (ADR) and Revenue Per Available Unit (RevPAU).
Get a 360 degree view
“Before the Occupancy Dashboard, you had to dig to find these metrics, resulting in a lot of property managers just going by intuition and guesswork instead of facts,” says Aldo Sicilia, product manager at Kigo. “But with charts and graphs just a click away, you’ve got the basis for making smart decisions about actions to take to boost your revenue and profit.”
The Occupancy Dashboard is a great aid in looking forward to upcoming reservations, vacancy levels and rates. But it will also provide the ability to look back in time at prior-year numbers to better predict the current year’s seasonal fluctuations. This lens into future occupancy helps not only with adjusting rates, but also things like staffing for cleaning and other services associated with the rentals. Filters allow you to specify the time periods and properties you want to look at. And you can export data to Excel to do your own analyses.
The Occupancy Dashboard can be used in conjunction with Kigo Revenue Management, which automatically weighs factors such as competitor rates, seasonality and vacancies to suggest the ideal rate to charge for every unit, every day to achieve maximum profit. With Kigo Revenue Management, you neither leave money on the table by charging too little, nor charge too much and end up with excessive vacancies.

Gain visibility and save time
“In addition to helping with decision making, the Occupancy Dashboard is a great way to get a birds-eye view of the status of your portfolio, to take the pulse of your business,” says Sicilia. “You don’t have to jump around looking for numbers to get a feeling for where you stand and where you might need to take action – now it’s all there on one intuitive screen, with graphics that communicate much more clearly than numbers alone do. In other words, it’s a fantastic reporting tool.”
“The Occupancy Dashboard is now built into the product at no cost, so we hope everyone will take advantage of it,” Sicilia concludes. “It’s a good example of how we don’t rest on our laurels, but are always pushing to make our software better and better.”
Learn more about the Kigo Occupancy Dashboard.


